Ecologists have long tried to understand what animals get up to when they’re not being observed. GPS technologies have enabled unprecedented remote-tracking, but some behaviours – such as diet – are a little more tricky to track. In this post James Grecian (@JamesGrecian), a marine ecologist at the Institute, discusses a technique he uses to track the diet of seabirds across some of the world’s most remote oceans; one that relies on a fundamental principle – you are what you eat.
Using stable isotope analysis to understand animal diet
One of the big challenges for me as a marine ecologist is to understand where marine animals travel and what they eat while at sea. By determining these things, we can understand their dependence on particular food sources, and whether these are being influenced by human and climate-factors. Furthermore, changes in the behaviour of marine animals like seabirds can also act as warning signals that forecast changes in other key populations that are more difficult to track, such as fish and plankton.
Observing animals during their migration is challenging, particularly when they may be many hundreds of kilometres offshore, but technological advancements have allowed us to follow individuals with miniaturised GPS loggers. However, to understand what an animal has been eating while not being observed needs a different kind of data logger, not electronic, but biological.
Fortunately, the composition of any organism’s tissues (be it feathers, hair, skin or bone) provides an excellent biological record of its diet when that tissue was made – you really are what you eat! To understand this biological record we need a natural marker that is incorporated from food into the an animal’s body, one that we can readily measure. For this I’d like to introduce you to stable isotope analysis.
Tracing signatures of diet
In 1913, Glasgow based chemist Frederick Soddy realised that atoms of a single chemical element could occur as atoms with different atomic weights. All atoms are composed of protons, neutrons and electrons, with the different elements defined by the number of protons they have (e.g. six protons = carbon). The total mass of an atom is the sum of its protons and neutrons (e.g. six protons + six neutrons give carbon a mass of 12, or 12C), but Soddy realised that many elements exist in forms that have additional neutrons, effectively giving heavy and light versions of the same element – he called these isotopes.
Whilst Soddy’s work described radioactive isotopes of unstable elements such as uranium, which emit radiation as they decay, not all isotopes are radioactive. Many elements found in nature have stable (non-radioactive) isotopes. These don’t decay or release radiation, so remain constant in the environment. For example, while almost all carbon on Earth (~99%) is 12C (six protons/six neutrons), 1% occurs as the alternative stable isotope 13C (six protons/seven neutrons).
Stable isotope analysis is the process of examining the relative abundance of two isotopes of an element (e.g. 13C :12C) using mass spectrometry. By comparing these abundances with an international reference standard we can measure the variation in these ratios (written as δ13C for carbon) compared to that standard, and get a unique value for any given sample.
Stable isotope ratios differ with ecological processes, as the small difference in atomic mass of an isotope can change its behaviour during metabolism. In the case of carbon, δ13C differs between plants that use C3 photosynthesis, the most common kind, and those that use the C4 photosynthetic pathway, an adaptation to arid environments as it is more water efficient. Due to differences in oceanic productivity, δ13C will also vary between coastal waters and more oceanic areas; and with latitude. This variation allows us to assess the relative importance of particular ecosystems or oceanic areas to an individual.
Another element commonly used in stable isotope analysis is nitrogen. During protein synthesis the lighter isotope 14N is lost from the body, whereas the heavier 15N is retained because more energy is required to metabolise it. As a result, the higher up the food web a consumer is, the greater the proportion of 15N in its tissues.
If we know when a particular tissue was formed, we can infer something about the diet of that individual by analysing the stable isotopes in that tissue. For example, sampling the isotope ratios of regularly replaced tissues, such as an individual’s blood, could tell us something about the diet of that individual over the preceding month; while sampling more durable tissue, such as a feather, can provide information on the diet and location of an individual when that feather was grown during the last winter.
Armed with this information the possibilities for applying stable isotope analysis to our research are endless!
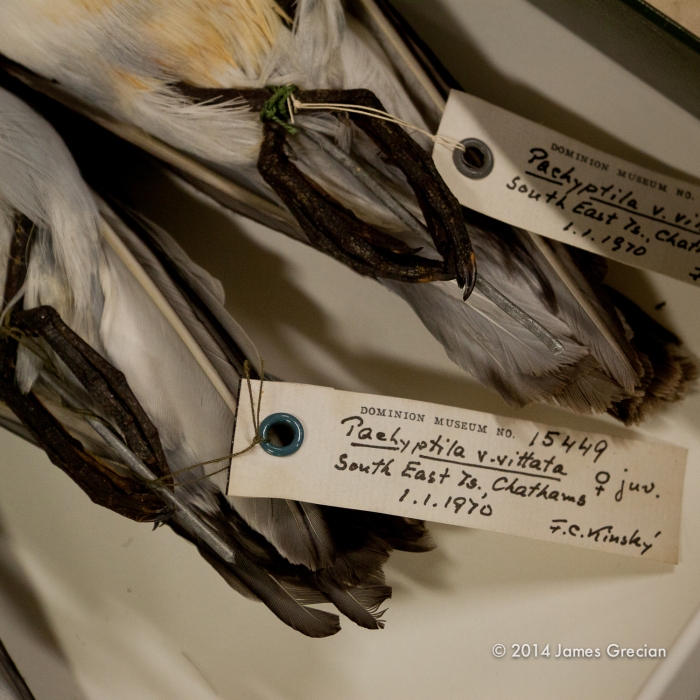
In recent years I’ve collaborated with the Museum of New Zealand Te Papa Tongarewa to examine changes in δ13C of feather material from specimens in the museum collection. By sampling the feathers of a group of seabirds called prions collected at the same sub-Antarctic islands over the last century, we’ve been able to trace changes in their migration patterns that could be linked to warming of the Southern Ocean.
I’ve also been involved in work that looked at the contribution of fishery discards to the diet of seabirds. Fishing fleets often catch and discard undersized or non-target fish; these species tend to be bottom-feeders (demersal) and so swim below the diving ability of large birds, such as gannets. Demersal fish have higher δ15N values than fish that live in the open ocean (pelagic), which are within reach of diving gannets. Consequently, when an individual bird feeds on fishery discards this change is reflected in the δ15N values of their tissues, such as blood and feathers.

In our recent paper I investigated the potential causes of natural variation in stable isotope ratios. When individuals move between different habitats and switch prey types, these differences are reflected in the isotopic signatures of tissues grown during this time. However, many studies often take only one tissue sample per individual when conducting these kinds of analyses, so understanding this kind of variation is difficult. By taking multiple samples from many individuals, we have found differences in carbon and nitrogen isotopes within single feathers. We think that some of these differences may be due to changes in the diet or distribution of individuals during the time that the feathers were growing, but we also find consistent differences in δ13C between structurally different parts of a feather. This may be due to differences in the composition of amino acids – the building blocks of proteins – between the different keratin structures in a feather, but we need to do more work to confirm this.
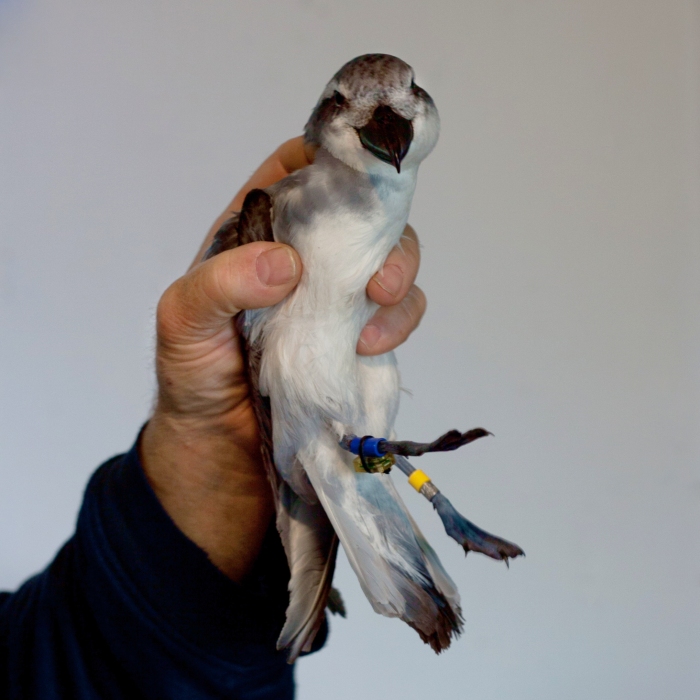
While these findings complicate our interpretation of isotope signatures, they pose some interesting questions. I’m now examining the movements of these birds in detail to understand where they go during the winter and what their habitat preferences are. Hopefully this information will help us to build a better understanding of their lives when they are out at sea.
Further reading
- Stauss, C., Bearhop, S., Bodey, T., Garthe, S., Gunn, C., Grecian, W., Inger, R., Knight, M., Newton, J., Patrick, S., Phillips, R., Waggitt, J., & Votier, S. (2012). Sex-specific foraging behaviour in northern gannets Morus bassanus: incidence and implications Marine Ecology Progress Series, 457, 151-162 DOI: 10.3354/meps09734
- Grecian, W., McGill, R., Phillips, R., Ryan, P., & Furness, R. (2015). Quantifying variation in δ 13C and δ 15N isotopes within and between feathers and individuals: Is one sample enough? Marine Biology DOI: 10.1007/s00227-015-2618-8

2 thoughts on “You are what you eat”